
If you’ve searched for DPMO meaning explained, you’ve probably run into two different answers online — one about texting slang, and one about quality management. This guide only covers the real business definition: what DPMO means, how to calculate it, how to avoid the mistakes most explanations skip, and how it connects to Six Sigma.
By the end, you’ll understand not just what the acronym stands for, but how to actually use it in a real process.
What Does DPMO Mean?
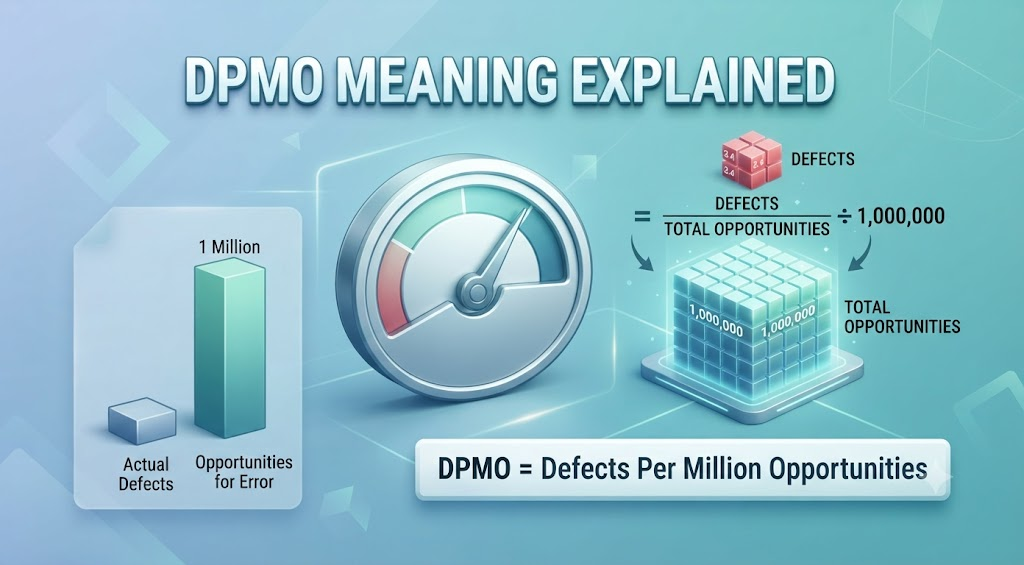
DPMO stands for Defects Per Million Opportunities. It’s a quality metric that estimates how many defects would occur in a process if it had one million chances to fail.
This is the core of any proper DPMO meaning explained breakdown: DPMO doesn’t just count defects — it counts defects relative to the number of chances a defect had to happen. That distinction matters more than most short definitions let on.
Here’s why. Imagine two factories:
- Factory A makes 1,000 units a day and finds 20 defects.
- Factory B makes 1,000 units a day and finds 20 defects too — but each unit in Factory B has five separate steps where something could go wrong, while Factory A’s units only have one.
Both factories have the same raw defect count. But Factory B’s process is actually performing better, because its units had five times as many chances to fail and still only produced the same number of defects. A simple defect count can’t show you that. DPMO can.
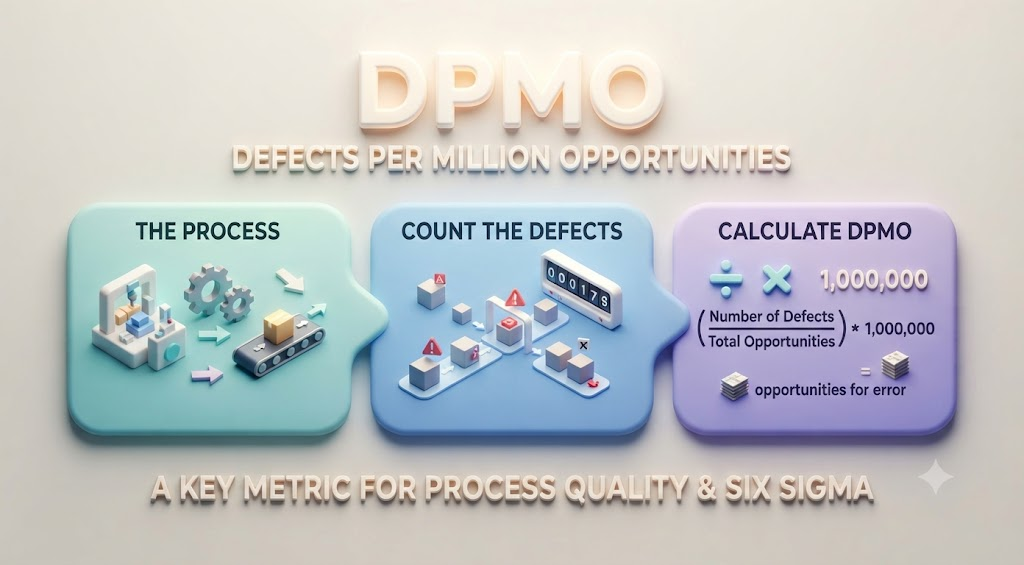
The DPMO Formula
The formula behind any accurate DPMO meaning explained article looks like this:
DPMO = (Total Defects ÷ (Units Inspected × Opportunities per Unit)) × 1,000,000
Broken into plain steps:
- Count the total number of defects found.
- Count the number of units inspected.
- Identify how many defect opportunities exist per unit.
- Multiply units × opportunities per unit to get total opportunities.
- Divide total defects by total opportunities.
- Multiply that result by 1,000,000.
Worked Example 1: Manufacturing
Say a furniture company inspects 500 chairs. Each chair has 4 possible defect points: leg assembly, seat attachment, finish quality, and hardware fit.
| Metric | Value |
|---|---|
| Units inspected | 500 |
| Opportunities per unit | 4 |
| Total opportunities | 2,000 |
| Defects found | 60 |
| DPMO | 30,000 |
Calculation: (60 ÷ 2,000) × 1,000,000 = 30,000 DPMO
That means for every one million chairs produced under identical conditions, this process would be expected to generate roughly 30,000 defects.
Worked Example 2: A Service Process (Not Just Manufacturing)
Most explanations stop at factory examples. But DPMO applies just as well outside manufacturing — which is exactly where a lot of readers searching “dpmo meaning explained” actually need it: call centers, billing, healthcare, and logistics.
Take a billing department processing 300 invoices. Each invoice has 3 defect opportunities: incorrect amount, wrong customer details, and late issuance.
| Metric | Value |
|---|---|
| Units inspected | 300 |
| Opportunities per unit | 3 |
| Total opportunities | 900 |
| Defects found | 18 |
| DPMO | 20,000 |
Calculation: (18 ÷ 900) × 1,000,000 = 20,000 DPMO
This service process is performing better than the chair factory above — a lower DPMO means fewer expected defects per million opportunities, regardless of industry.
How to Correctly Define an “Opportunity”
This is the part most guides gloss over, and it’s the single biggest reason DPMO calculations go wrong in practice.
An opportunity is any point in a process where a defect could occur — but not every possible thing that could theoretically go wrong should count. If you inflate the opportunity count, your DPMO looks artificially low. If you undercount it, your DPMO looks artificially high and unfairly harsh.
Use this rule of thumb when deciding whether something qualifies as a real opportunity:
- It must be independently measurable — you can check it without checking something else first.
- It must be tied to a defined requirement or specification — not a vague preference.
- A failure at that point would realistically cause rework, customer impact, or compliance risk.
- It should be consistent across every unit — if only some units have that opportunity, it doesn’t belong in the standard count.
Common mistakes that distort DPMO:
- Counting the same failure twice under two different “opportunity” labels
- Including opportunities that are cosmetic and don’t affect function or compliance
- Changing the opportunity definition between measurement periods, making trend comparisons meaningless
- Using a sample size too small to represent the real process (fewer than 30 units skews results significantly)
- Treating every unit as having identical opportunities when complexity actually varies by batch or product line
Getting this step right is what separates a useful DPMO meaning explained resource from a purely academic one — onb meaning the formula is easy; defining opportunities correctly is where the real skill is.

DPMO to Sigma Level Conversion
DPMO becomes far more useful once you connect it to a Sigma Level, which shows how mature a process is. Lower DPMO equals a higher, more capable Sigma Level.
| Sigma Level | DPMO (approx.) | Process Yield |
|---|---|---|
| 1 Sigma | 691,462 | 30.9% |
| 2 Sigma | 308,538 | 69.1% |
| 3 Sigma | 66,807 | 93.3% |
| 4 Sigma | 6,210 | 99.38% |
| 5 Sigma | 233 | 99.977% |
| 6 Sigma | 3.4 | 99.9997% |
So in the chair factory example above, a DPMO of 30,000 places that process just above the 3 Sigma level — meaning roughly 93–94% of chairs are defect-free relative to their opportunities, but there’s real room for improvement before reaching 4 Sigma performance.
DPMO vs. Related Quality Metrics
Anyone researching DPMO meaning explained content usually runs into a handful of similar-sounding acronyms. Here’s how they actually differ:
| Metric | Full Name | What It Measures |
|---|---|---|
| DPMO | Defects Per Million Opportunities | Defects relative to total opportunities, standardized to one million |
| PPM | Parts Per Million | Defective units out of one million units (ignores opportunities per unit) |
| DPU | Defects Per Unit | Total defects divided by total units inspected |
| DPO | Defects Per Opportunity | Total defects divided by total opportunities (DPMO without the ×1,000,000) |
| FPY | First Pass Yield | Percentage of units that pass inspection with zero defects on the first try |
| RTY | Rolled Throughput Yield | Combined yield across multiple process steps |
The key distinction: PPM treats every unit as having a single chance to fail. DPMO accounts for the fact that complex products or services have multiple failure points per unit — which is why DPMO is considered more accurate for anything beyond simple, single-step processes.
Why DPMO Matters in Six Sigma
Six Sigma is a quality management methodology built around reducing process variation, and DPMO is one of its foundational metrics. The goal within Six Sigma isn’t just “fewer defects” in a vague sense — it’s a measurable, standardized reduction that can be tracked over time and compared across completely different processes.
That comparability is what makes DPMO valuable. A hospital’s medication-dispensing process and a manufacturer’s assembly line have nothing in common on the surface, but both can be scored on the same DPMO scale and both can be pushed toward the same Sigma Level targets.
Industries That Use DPMO
A complete DPMO meaning explained overview should go beyond manufacturing, because the metric shows up in surprisingly varied fields:
- Manufacturing — tracking defects across sourcing, assembly, and packaging stages
- Healthcare — monitoring medication errors, lab result accuracy, and patient record mistakes
- Call centers and customer service — measuring dropped calls, incorrect resolutions, or escalation errors
- Logistics and fulfillment — tracking mis-picks, shipping delays, and packaging damage
- Software and QA testing — measuring bugs per feature or per release cycle
- Finance and billing — tracking invoice errors, incorrect charges, or compliance mismatches
Common Mistakes to Avoid When Calculating DPMO
Even after the formula and opportunity definitions are clear, calculation errors are common. Watch for these:
- Using too small a sample size — small samples exaggerate the effect of a single defect.
- Miscounting opportunities per unit — this single number heavily skews the final DPMO.
- Comparing DPMO across processes with inconsistent opportunity definitions — a fair comparison requires identical criteria.
- Ignoring seasonal or batch variation — a single snapshot may not represent the process over time.
- Treating DPMO as a one-time calculation — it’s meant to be tracked continuously, not measured once and filed away.
How to Use DPMO to Improve a Process
Once you’ve calculated DPMO, the number itself isn’t the end goal — it’s a diagnostic tool. Here’s the typical workflow:
- Calculate the current DPMO for the process.
- Break down defects by category to find where most failures cluster.
- Prioritize the highest-impact failure points first (not necessarily the most frequent ones — the costliest).
- Implement a targeted fix at that specific step.
- Recalculate DPMO after the change to confirm improvement.
- Repeat continuously — DPMO tracking works best as an ongoing cycle, not a one-off audit.
Frequently Asked Questions
What does DPMO stand for?
DPMO stands for Defects Per Million Opportunities, a metric used to measure how many defects a process would produce out of one million chances for a defect to occur.
Is DPMO the same as PPM?
No. PPM measures defective units per million units, while DPMO accounts for multiple defect opportunities within each unit, making it more precise for complex processes.
What is considered a good DPMO score?
A DPMO below roughly 6,210 typically corresponds to a 4 Sigma process, which is considered strong performance in most industries; world-class processes aim for 6 Sigma, or about 3.4 DPMO.
Can DPMO be used outside manufacturing?
Yes. DPMO applies to any process with measurable steps, including healthcare, customer service, software development, and logistics.
How is DPMO different from DPU?
DPU (Defects Per Unit) only counts total defects against total units, while DPMO factors in the number of opportunities per unit, giving a more standardized comparison.
What sample size should I use for DPMO?
Most quality teams recommend at least 30 units, though larger samples produce more statistically reliable results, especially for low-defect processes.
Does a lower DPMO always mean a better process?
Generally yes, but only if the opportunity definitions are consistent — comparing DPMO scores calculated with different opportunity criteria can be misleading.
Final Thoughts
A proper DPMO meaning explained resource needs to go past the basic definition and formula — the real value comes from knowing how to define opportunities correctly, how DPMO maps to Sigma Levels, and how it compares to related metrics like PPM and DPU. Used correctly and tracked consistently, DPMO turns vague quality concerns into a measurable, comparable number you can actually act on.
